April 2021 Commercial Truck Resale Values
Price Digests’ Data Powered Values
This month we are sharing resale values for commercial trucks from April 2021 as well as the previous 24 months to help you understand trends in the market. Price Digests is a trusted source for commercial truck values, providing clients with high-quality, big data-powered values information, including MSRP/cost new, resale, finance, wholesale, and trade-in. Specifically, this month’s analysis includes resale values for more than 17,000 unique models and configurations and 20 model years. In all, more than 350,000 data points have been included in just the information provided here for medium and heavy duty trucks.
Commercial Truck Resale Values Trends
Values for April 2021 for both medium and heavy duty commercial trucks were down slightly month-over-month, but were up more than 20% each year-over-year and were both up about 32% compared to April 2019. Average resale value deltas are detailed in the table below.
| Commercial trucks | MoM¹ % | YoY² % | YoY³ % |
|---|---|---|---|
| Heavy duty trucks | -0.6% | 26.6% | 32% |
| Medium duty trucks | -1.5% | 21.6% | 32.1% |
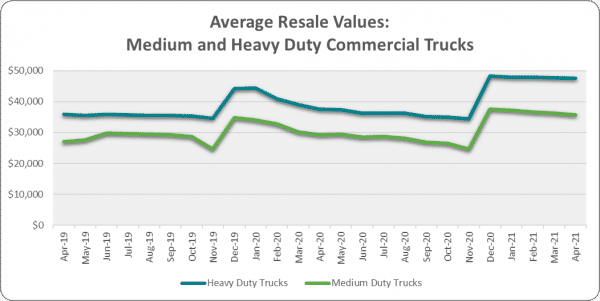
The graph below shows the average resale values for medium and heavy duty commercial trucks over the past two years. Each December, when new model years are added to the dataset, we can see a distinct bump in the values which is adjusted for in the January average which keeps the age of vehicles in the calculation to 20 years or less. Besides that December bump, however, we can see average resale values in much of 2020 were similar to what we saw in 2019. In contrast, 2021 is so far seeing much higher average values.

Overall, depreciation of values for new commercial trucks appears to be much more gradual in 2021 compared to 2020. This is particularly true for heavy duty commercial trucks, which saw the rate of depreciation from December through April drop by half in 2021 compared to 2020.
A recent Price Digests analysis of average resale list prices and ages showed similar increases in pricing and a Q1 2021 bump in the age of listed vehicles. The increase in values, list prices, and listed vehicle ages are likely all tied to the delivery delays of new trucks being experienced by commercial truck manufacturers compounded with strong demand for new commercial trucks4.
A Closer Look at Heavy Duty Truck Resale Value Trends
As mentioned above, average resale values for heavy duty trucks in April 2021 were down slightly month-over-month but were up 26.6% year-over-year and were up 32.0% compared to April 2019. The heavy duty truck category includes both classes 7 and 8, as well as popular vehicle types such as sleepers, day cabs, and cab and chassis. To understand these topline figures a bit better, we are breaking out the heavy duty resale values by both size classes and popular vehicle types below.
Value Trends for Classes 7 and 8
As mentioned above, average resale values for heavy duty trucks in April 2021 were down slightly month-over-month but were up 26.6% year-over-year and were up 32.0% compared to April 2019. The heavy duty truck category includes both classes 7 and 8, as well as popular vehicle types such as sleepers, day cabs, and cab and chassis. To understand these topline figures a bit better, we are breaking out the heavy duty resale values by both size classes and popular vehicle types below.
| Heavy duty trucks | MoM¹ % | YoY² % | YoY³ % |
|---|---|---|---|
| Size Class 7 | -2% | 61% | 43.7% |
| Size Class 8 | -0.2% | 19.7% | 30.4% |
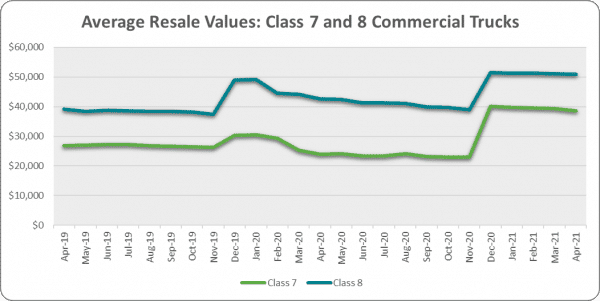
The gap in values between these two classes of commercial trucks also narrowed in recent months. From April 2019 through December 2020, the average value for a size class 8 truck was about 1.6 times that of a size class 7 truck. So far in 2021, the average differential has shrunk to about 1.3x. This narrowing in relative values can be seen in the chart below.

Value trends for Heavy Duty Sleeper, Day Cab, and Cab and Chassis
Heavy duty sleepers were the one truck type reviewed in this analysis to show a month-over-month increase in average resale values, gaining 0.8% from March 2021 to April 2021. Heavy duty day cabs and cab and chassis both saw month-over-month declines in average resale values. All three truck types showed strong appreciation in values both year-over-year and compared to April 2019, as shown in the table below.
| Heavy duty trucks | MoM¹ % | YoY² % | YoY³ % |
|---|---|---|---|
| Heavy Duty Sleeper | 0.8% | 20% | 38.9% |
| Heavy Duty Day Cab | -0.9% | 18.1% | 28.6% |
| Heavy Duty Cab and Chassis | -1.2% | 31.8% | 27.1% |
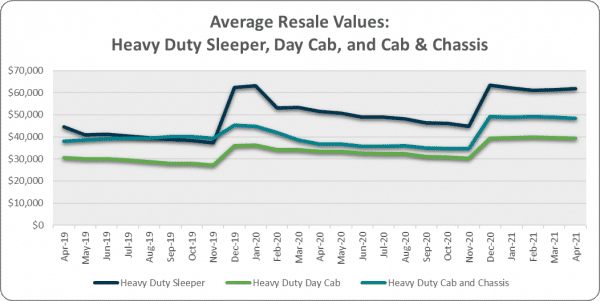
The graph below shows the average resale values for each of the three popular truck types from April 2019 through April 2021. While all three saw increases over the two years, we can see that heavy duty sleeper values increased the most from where they started. There is also a more distinct gap in values between the truck types in 2021 than there has been over the previous months shown, in particular for sleepers versus cab and chassis from April 2019 through November 2019 and for cab and chassis versus day cabs from April through November 2020. These changes in relative values likely reflect the differences in demand for the different truck types over time, in particular with the strong demand for sleepers for long haul transportation of goods since at least March 2020.

About Price Digests
Since 1911 Price Digests, a division of Informa, has served the vehicle data needs of the insurance, finance, government, and dealer markets through its portfolio of VIN decoding, specifications, and market value data solutions for the commercial truck, passenger vehicle, marine, powersport, and recreational vehicle asset classes. Our data insights help enterprises drive competitive advantage through asset data workflow efficiencies while also playing a pivotal role in decisions surrounding the purchase, valuation, operation, and risk mitigation of assets. Price Digests data is powered by The Truck Blue Book.
References:
[1] Month-over-month percentage change in the average value. Changes shown are for April 2021 compared to March 2021.
[2] Year-over-year percentage change in the average value. Changes shown are for April 2021 compared to April 2020.
[3] Percentage change in average value compared to two years ago. Changes shown are for April 2021 compared to April 2019.
[4] Supply chain bottlenecks continue to impact CV outlook. Retrieved May 14, 2021


